Wednesday, 31 October 2018

Three papers on the economics of rugby

Not intentionally, it seems I've been saving up a few posts on the economics of rugby. So, rather than release them individually, I've collated all three into a single post. To start with, consider the effects of bonus points in rugby competitions. Bonus points (for scoring more tries, or for a narrow loss) are argued to be useful because they give teams a secondary objective besides winning the game, and provide incentives for teams to engage in more exciting, open play when the overall (win/loss) outcome of the game is already decided.

2014 article by Niven Winchester (MIT), published in New Zealand Economic Papers (ungated version here), evaluates whether the addition of bonus points in the Six Nations Championship in Europe would more accurately rank the teams at the end of the competition. Winchester used data from 1997 to 2012, and found that:
[t]he bonus for scoring four or more tries is not significantly correlated with team strength, but there is moderate evidence that awarding a bonus for scoring three or more net tries can improve the accuracy of league standings.
Would implementing bonus points have changed who won the Championship? It turns out yes:
In 2007, France and Ireland recorded the same number of wins, but France claimed the title by scoring more net points during the competition. Under both bonus systems, however, Ireland would have finished ahead of France, as they picked up one more narrow-loss bonus and at least as many try bonuses.
I guess if you are a fan of Irish rugby, you're now also a fan of bonus points.

Are all bonus points good though? A 2015 paper by Liam Lenten (La Trobe University) and Niven Winchester (again), published in the journal The Economic Record (ungated version here), focused on the bonus point for narrow losses in Super Rugby. Lenten and Winchester were testing to see whether teams that were close to earning a bonus point for scoring a fourth try in the last 10% (8 minutes) of the game were more likely to score the bonus point try (holding all other things, including the game margin, strength of teams, home and away, etc. constant). Using data from 958 matches over the period from 2002 to 2012, they found that:
[w]hile simple comparisons predominantly fail to show a significant difference, the probit regressions demonstrate that tries are more likely to be scored by teams who stand to earn a bonus point by scoring an additional try, but only when the result is most likely decided.
In other words, the incentive for engaging in more attractive, open play in order to earn the four-try bonus point only paid off for teams that were already losing by 15 points or more. This hardly seems like a strong case for this bonus point, and might go some way towards explaining the change to a bonus point for three 'net tries' (i.e. scoring three more tries than your opposition). I spent most of this paper wondering about Lenten and Winchester's choice of the final eight minutes, and wondering if their results were sensitive to that choice (and thinking there might be an opportunity for an Honours or Masters student to test it). However, nearly at the end of the paper their sensitivity analyses revealed that they had already done this work, and the effect was significant for up to the last 13 minutes of the game.

Finally, the late John McMillan (UC San Diego at the time, later at Stanford) wrote perhaps one of the first articles on the economics of rugby, published in 1997 in New Zealand Economic Papers (ungated version here). This is an interesting article, because it was written just after rugby became a professional sport, so there were many unanswered questions. McMillan's article has aged really well, and the issues he raised are still relevant today. In particular, he focused on two aspects of the newly professional sport: (1) competitive balance; and (2) the optimal degree of centralisation. With regard to the latter, he wrote that:
As with any kind of organization, the key question in structuring professional rugby is:  what is the right degree of centralization? Organizations exist to provide coordination.  But central control weakens individual responsibility, so muted incentives are the cost of coordination. Rugby must find the right balance between control and incentives. In one sense, as I shall argue, coordination of the teams is needed for the "product" to be high quality. In another, too much central control could destroy the "product."
Many long-time rugby fans would argue that the quality of the product (Super Rugby especially) has been progressively debased with the addition of more teams and more games. I know that I certainly watch a lot less than I used to, even though there are now many more games. In McMillan's view, this reduction in quality suggests that there is too much centralisation, and the franchises need a bit more autonomy. Although it hasn't gotten quite as bad as this:
Under a monolithic structure, rugby could come to resemble professional wrestling.
Hulk Hogan vs. Jonah Lomu would have been epic. A missed opportunity?

Tuesday, 30 October 2018

Comparative advantage and the gender gap in STEM

My posting frequency has been down a little this month, due to other pressing deadlines, PhD students submitting their theses, and teaching and marking commitments. That has also affected my ability to keep up with reading recent research. However, I made time today to catch up on two recent articles that particularly caught my attention.

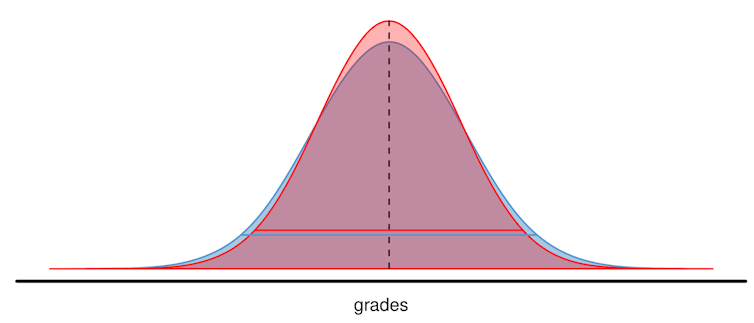
The first was this paper by Rose O'Dea, Malgorzata Lagisz (both UNSW), Michael Jennions (ANU), and Shinichi Nakagawa (UNSW), published in the journal Nature Communications. O'Dea and Nakagawa wrote about the paper in The Conversation late last month. The paper was based on a meta-analysis (an analysis that combined the results from many different studies into a single analysis) of 227 other studies that included over 1.6 million high school students. It tested the 'variability hypothesis' - the idea that male students in STEM (Science, Technology, Engineering, and Maths) subjects show greater variability in performance. That means that there are more male students than female students in each tail of the distribution - more male students than female students do very poorly, and more male students than female students do very well. So, you can think of the distributions of male and female students' grades as something like this:
The blue distribution (males) has a smaller peak and fatter tails than the red distribution (females), so there are more male students at the top of the distribution. Note that the distributions have the same mean, which is not what we would expect, since female students on average tend to do better. O'Dea et al. confirm that result, but also find some support for the variability hypothesis:
Overall, girls had significantly higher grades than boys by 6.3%... with 10.8% less variation among girls than among boys...
Girls’ significant advantage of 7.8% in mean grades in non-STEM was more than double their 3.1% advantage in STEM... Variation in grades among girls was significantly lower than that among boys in every subject type, but the sexes were more similar in STEM than non-STEM subjects...
In other words, girls had higher grades than boys in both STEM and non-STEM subjects, but the difference in the variability in grades was higher for non-STEM, not STEM, subjects. Here's the resulting distributions:


The ratio of female to male students is equal to one (equal numbers of female and male students) in the top 10% of the distribution of STEM grades, and in the top 2% of non-STEM grades. For the top X% of grades below those thresholds, there are more female than male students (and above those thresholds, there are more male than female students).

Essentially, based on these results, female students outperform male students in both STEM and non-STEM, but they outperform male students by more in non-STEM than in STEM. Which makes these results complementary to those of the second article, by Gijsbert Stoet (Leeds Beckett University) and David C. Geary (University of Missouri), published in the journal Psychological Science (gated, but for the moment at least, this link appears to take you directly to the PDF). Stoet and Geary use PISA (Programme for International Student Assessment) data from over 472,000 students from 67 countries, to look at the intra-individual academic strengths of male and female high school students. Basically, for each student they calculated whether the student performs better (or worse) in reading, maths, or science, compared with the other two subject areas, and by how much better (or worse) they did. They then compare those results between male and female students. They found that:
...there were consistent sex differences in intraindividual academic strengths across reading and science. In all countries except for Lebanon and Romania (97% of countries), boys’ intraindividual strength in science was (significantly) larger than that of girls... Further, in all countries, girls’ intraindividual strength in reading was larger than that of boys, while boys’ intraindividual strength in mathematics was larger than that of girls. In other words, the sex differences in intraindividual academic strengths were near universal...
We found that on average (across nations), 24% of girls had science as their strength, 25% of girls had mathematics as their strength, and 51% had reading. The corresponding values for boys were 38% science, 42% mathematics, and 20% reading.
In other words, female students' relative strength was more likely to be in reading, while male students' strength was more likely to be in science or mathematics. They also found that male students were more likely to overestimate their ability in science than female students were.

Alex Tabarrok at Marginal Revolution has the best take on Stoet and Geary's results:
Now consider what happens when students are told. Do what you are good at! Loosely speaking the situation will be something like this: females will say I got As in history and English and B’s in Science and Math, therefore, I should follow my strengthens and specialize in drawing on the same skills as history and English. Boys will say I got B’s in Science and Math and C’s in history and English, therefore, I should follow my strengths and do something involving Science and Math.
Note that this is consistent with the Card and Payne study of Canadian high school students that I disscused [sic] in my post, The Gender Gap in STEM is NOT What You Think. Quoting Card and Payne:
"On average, females have about the same average grades in UP (“University Preparation”, AT) math and sciences courses as males, but higher grades in English/French and other qualifying courses that count toward the top 6 scores that determine their university rankings. This comparative advantage explains a substantial share of the gender difference in the probability of pursing a STEM major, conditional on being STEM ready at the end of high school."
and myself:
"Put (too) simply the only men who are good enough to get into university are men who are good at STEM. Women are good enough to get into non-STEM and STEM fields. Thus, among university students, women dominate in the non-STEM fields and men survive in the STEM fields."
So, even though female students may be better than male students in STEM subjects at school, we may see fewer of them studying those subjects at university (let alone taking them as a career), because female students are also better in non-STEM subjects at school, and they are better by more in non-STEM than in STEM, compared with male students. Economists refer to this as the students following their comparative advantage. Female students have a comparative advantage in non-STEM, and male students have a comparative advantage in STEM subjects. That is different from absolute advantage (which female students appear to have in both subject areas, at least according to O'Dea et al. - the gender differences in average results are not consistently significant in Stoet and Geary). The O'Dea et al. results and the Stoet and Geary results both support this comparative advantage interpretation.

One final result from Stoet and Geary still needs further exploration. They report that:
...the relation between the sex differences in academic strengths and college graduation rates in STEM fields is larger in more gender-equal countries.
That is a surprising result. If we thought that making genders more equal would reduce the gender gap in STEM, we would expect the exact opposite result! Stoet and Geary's proffered explanation for this seems particularly weak:
Countries with the highest gender equality tend to be welfare states (to varying degrees) with a high level of social security for all its citizens; in contrast, the less gender-equal countries have less secure and more difficult living conditions, likely leading to lower levels of life satisfaction...
So, because people feel more secure in countries with better welfare states, which are also the countries with higher gender equality, they are less likely to pursue the high-risk, high-reward jobs in STEM fields, than safer jobs in non-STEM fields. That definitely needs more follow-up research.

Read more:


Monday, 29 October 2018

Price discrimination and airline tickets

Earlier this month, Rob Nicholls (UNSW) wrote an article on The Conversation about airline ticket prices:
Few things are more annoying than spending a large sum of money on a purchase, only to discover that someone else got the same thing for a lower price. This often happens with airfares. You go the same website, search the same airline, choose the same seat row and fare conditions, but you’re offered a different price depending on when and where you do it. Why?
Often it’s a result of price discrimination. This happens when a seller charges you what you’re willing to pay. Of course, it also needs to be at a level that the seller is willing to accept.
When it comes to airfares, there are two levels of price discrimination, both driven by algorithms. First, there is price discrimination by the airline. Airline pricing is typically dynamic. That is, the prices are higher for more popular flights. Then there are intermediary platforms, such as travel agents or price comparison websites, which can introduce a further level of price discrimination.
Nicholls' article is interesting, but it misses some important points about the price discrimination undertaken by airlines, and so it is worth also considering those points. First, price discrimination only occurs when the seller is selling the same product to different consumers for different prices, and where those differences in prices don't reflect differences in cost. So, the difference in price between premium economy airline tickets and economy airline tickets is not price discrimination, because there are differences in cost between those ticket classes.

Second, perfect price discrimination (first degree price discrimination, or personalised pricing) is when a seller charges you exactly what you're willing to pay. However, sellers typically don't know what you're willing to pay (you might not even know what you're willing to pay), so most sellers engage in some form of imperfect price discrimination.

In contrast, third degree price discrimination (group pricing) occurs when the sellers charges different prices to different known groups of consumers. This is the type of price discrimination that movie theatres engage in, when they sell the same tickets to students or seniors for a lower price than general admission. This isn't the type of price discrimination that airlines engage in.

Airlines typically engage in second third degree price discrimination. This is where However, in this case the seller doesn't know the willingness to pay of the consumer, and doesn't know what group they belong to, but they can infer from the consumer's choices how much they are willing to pay. One type of second third degree price discrimination is menu pricing. It's called menu pricing, because it is the type of pricing that restaurants use. The seller offers a menu of different options, and knows which options will appeal to consumers with relatively inelastic demand (where the mark-up should be higher), and other options will appeal to consumers with relative elastic demand (where the mark-up should be lower).

Airlines don't quite have a menu. However, they do offer a range of options to consumers. Some consumers will buy a ticket close to the date of the flight, while others buy far in advance. That is information the airline can use. If you are buying close to the date of the flight, the airline can assume that you really want to go to that destination on that date, and that few alternatives will satisfy you (maybe you really need to go to Canberra for a meeting that day, or to Christchurch for your aunt's funeral). Your demand will be relatively inelastic, so the airline can increase the mark-up on the ticket price. In contrast, if you buy a long time in advance, you probably have more choice over where you are going, and when. Your demand will be relatively elastic, so the airline will lower the mark-up on the ticket price. This intertemporal price discrimination is why airline ticket prices are low if you buy far in advance.

Similarly, if you buy a return ticket that stretches over a weekend, or a flight that leaves at 10am rather than 6:30am, you are more likely to be a leisure traveller (relatively more elastic demand) than a business traveller (relatively more inelastic demand), and will probably pay a lower price.

The outcome, as Nicholls notes, is that you are unlikely to be paying the same ticket price as the person seated next to you on the plane. The ticket price you paid will be based on the airline's assessment of your willingness to pay, based on the choices you have made.

Sunday, 28 October 2018

Russ Roberts on the income distribution

Students in my ECONS102 class would have gotten the message in the last week of classes that much of the rhetoric (in New Zealand, at least) around inequality is somewhat misleading, if not just plain wrong. For example: "Inequality is getting worse over time". No, it's not. At least, not in New Zealand since about the mid-1990s (the data supports this - there are any number of posts by Eric Crampton that show it, but try this one for starters). You might believe that inequality is a Bad Thing, but you don't need to overstate your case - inequality can be a Bad Thing even if it is not getting worse.

In a new article on Medium, Russ Roberts takes aim at another data fallacy:
Adjusted for inflation, the US economy has more than doubled in real terms since 1975.
How much of that growth has gone to the average person? According to many economists, the answer is close to zero...
But the biggest problem with the pessimistic studies is that they rarely follow the same people to see how they do over time. Instead, they rely on a snapshot at two points in time. So for example, researchers look at the median income of the middle quintile in 1975 and compare that to the median income of the median quintile in 2014, say. When they find little or no change, they conclude that the average American is making no progress.
But the people in the snapshots are not the same people...
Studies that use panel data — data that is generated from following the same people over time — consistently find that the largest gains over time accrue to the poorest workers and that the richest workers get very little of the gains. This is true in survey data. It is true in data gathered from tax returns...
One explanation of these findings is there is regression to the mean — if your parents are particularly unlucky, they may find themselves at the bottom of the economy. You, on the other hand, can expect to have average luck and will find it easier to do better than your parents. At the other end of the income distribution, one reason you might have very rich parents is that they have especially good luck. You are unlikely to repeat their good fortune, so you will struggle to do better than they did.
To see the problem with the pessimistic studies, consider a very simple economy with just three people. In 2005, Anna has income of $10,000, Bill has income of $20,000, and Charlotte has income of $70,000. The median income is $20,000. The total income of the bottom two-thirds of the population is $30,000. The lowest one third of the population (Anna) earns only one seventh of the earnings of the top one third of the population (Charlotte).

Now, say you collect some data on these same people ten years later, and find that Anna now has income of $20,000, Bill has income of $80,000, and Charlotte has income of $5,000. The median income is still $20,000. The median income is still $20,000. The total income of the bottom two-thirds of the population has decreased from $30,000 to $25,000. The lowest one third of the population (Charlotte) earns only one sixteenth of the earnings of the top one third of the population (Bill). If you ignored the dynamics of the income changes, you would either conclude that lower-income people are no better off than ten years earlier (the median income has not changed), or that they are worse off (lower total earnings, or higher inequality). But that would ignore the fact that two-thirds of the population is actually better off than before.

Comparing cross-sections over time is fraught, and the potential for drawing erroneous conclusions is high. As Russ Roberts concludes:
If we want to give all Americans a chance to thrive, we should understand that the standard story is more complicated than we’ve been hearing. Economic growth doesn’t just help the richest Americans.
And unlike much of what we read about incomes and inequality in the U.S., Roberts' conclusion is probably true for New Zealand as well.

[HT: Marginal Revolution]